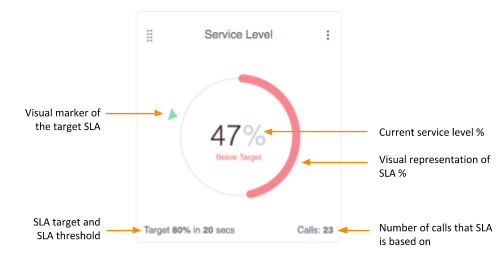
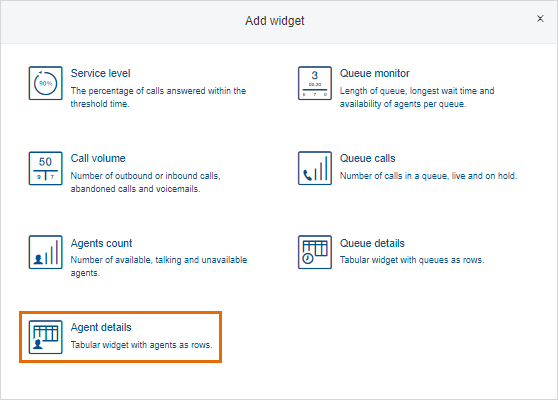
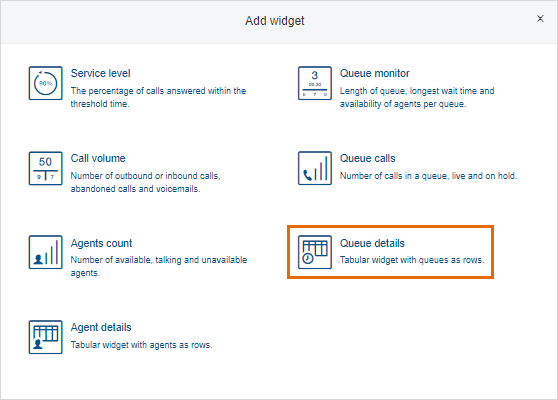
Service Level or SLA
This Widget measures a percentage of incoming calls that an agent answers during the desired time threshold to a total number of incoming calls for this queue. In general, this Widget allows you to track how well your team is doing in servicing clients within the expected time frame.
Prerequisites
Building an SLA report requires a few settings to be defined:
• A Call queue group
• Time zone of the queue
• Service Level Settings
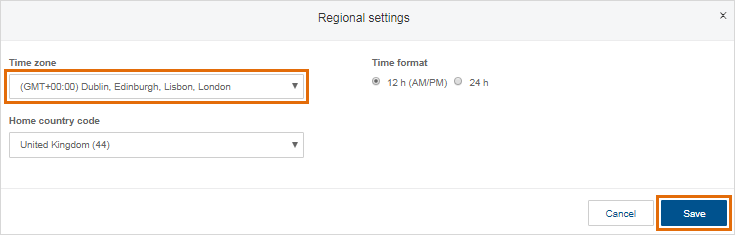
Time zone of the queue
This has to be properly set up to correctly calculate metrics for the queue. For more information on setting your time zone go to BT Cloud Phone: Setting the User's Hours of Operation and Time Zone.
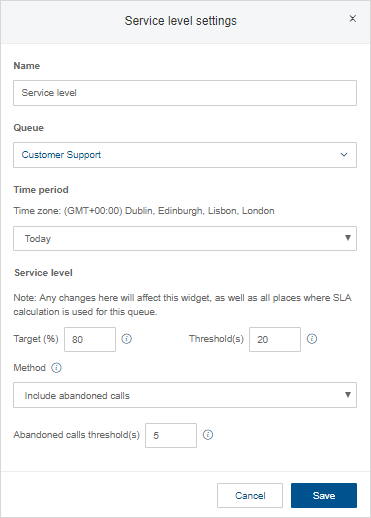
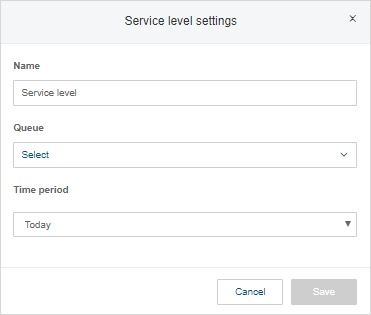
Service level settings
Set up your service level settings to define the parameters for your Service level target, Service level threshold, Include abandoned calls, and abandoned calls threshold.
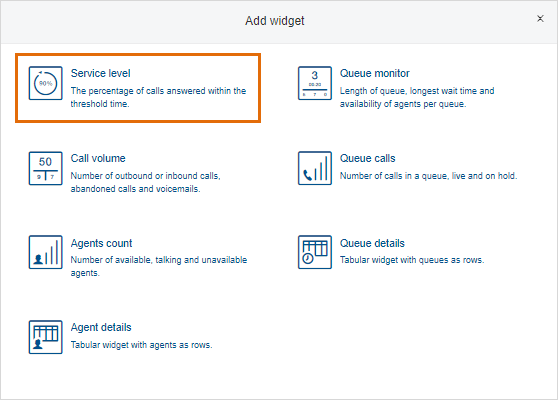
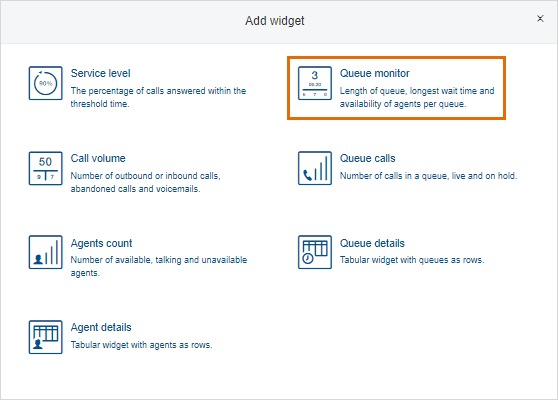
Adding an SLA Widget
Step 1:
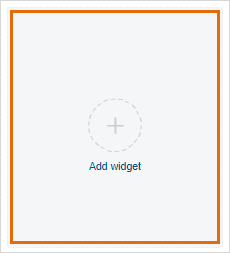
Click Add Widget.
Step 2:
Click Service level.
Step 3:
Fill out the following information.
1. Enter the Name.
2. Select a Queue to calculate the SLA for.
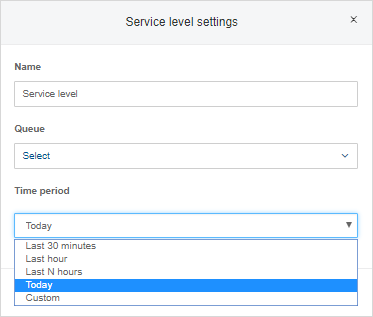
3. Select the Time period.
NOTE: The time period applies to Today only where today starts at midnight up to current time. Once the day is over and midnight is passed, the new period is started.
Step 4:
Set the Service level and the Method.
NOTE: The Method setting lets you include or exclude abandoned calls.
Click Save.

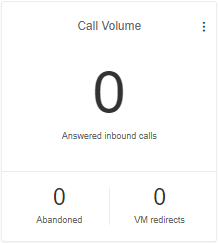
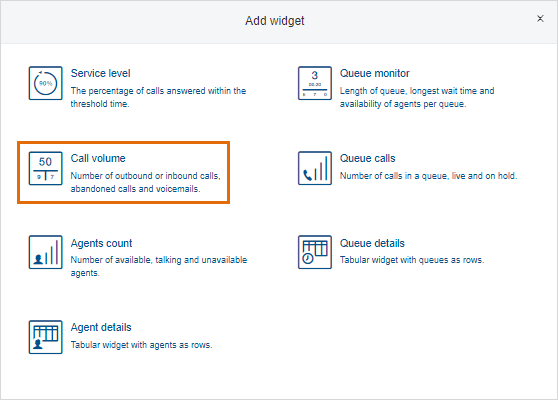
Call Volume
This Widget shows the volume of inbound calls including abandoned calls and voicemails or the volume of outbound calls.
Adding a Call Volume Widget
Step 1:
Click Add Widget.
Step 2:
Click Call volume.
Step 3:
Fill out the following information.
1. Enter the Name.
2. Select the type of Widget:
a. Inbound - Total, Abandoned, Voicemail Redirects
Shows the total number of inbound calls (including the number of voicemail redirects and abandoned calls), the number of redirects to the voicemail and the number of abandoned calls
b. Inbound - Answered, Abandoned, Voicemail Redirects
Shows the number of calls that were answered by agents in the queue, the number of redirects to the voicemails and the number of abandoned calls
c. Inbound - Total Calls
Shows the total number of inbound calls including VMs and abandoned calls
d. Outbound - Answered, Unanswered
Shows the number of outbound calls that were answered and the number of calls that were not answered.
e. Outbound - Total Calls
Shows the total number of all outbound calls,
3. Select a Queue.
4. Select the Time period.
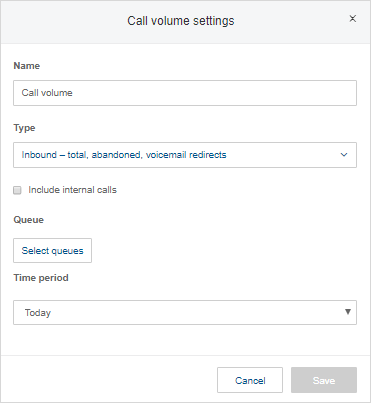
Step 4:
Click Save.

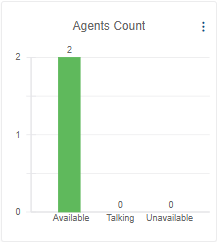
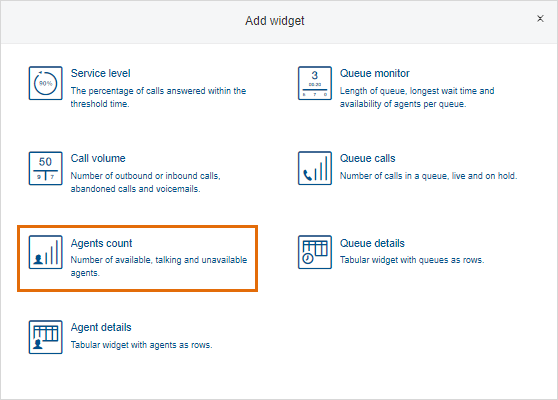
Agents Count
This Widget displays the agents count broken down by the availability status across one or multiple queues.
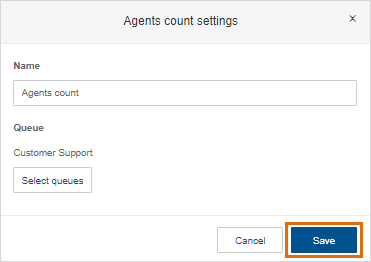
Adding an Agents Count Widget
Step 1:
Click Add Widget.
Step 2:
Click Agents count.
Step 3:
Fill out the following information.
1. Enter the Name.
2. Select one or multiple queues to show agents for.
NOTE: There is no need to set the time period since this Widget displays data at the current moment.
Step 4:
Click Save.
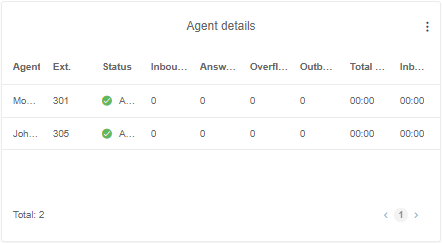
Agent Details
This Widget shows the breakdown of metrics by agents.
Adding an Agent Details Widget
Exporting Data
Metrics and Columns Available
• Ext - shows the extension of an agent.
• Status - shows the current status of an agent: Available, On Call, Unavailable.
• Inbound Calls - count of all inbound calls directed to an agent - these include calls to queue and direct calls to the agent extension.
• Inbound Answered - count of all inbound calls answered by an agent, both queue call and direct calls.
• Overflow Answered - count of queue calls answered by members of overflow queues.
• VM Redirects - count of redirects of calls to the voicemail regardless of whether a voice message was left.
• Outbound Calls - count of all outbound calls made by an agent.
• Outbound Answered - count of outbound calls made by the agent that were connected either to a person or to a voicemail.
• Outbound Unanswered - count of outbound calls made by an agent that were not connected due to the busy tone, nobody answering the phone or other reason.
• Total Talk Time - total duration of time for both inbound and outbound calls an agent handled. For outbound calls, this includes any hold time.
• Inbound Talk Time - total duration of actual live talk an agent spends with a customer during an inbound call. This does not include the time the agent placed the customer on hold.
• Outbound Talk Time - total duration of actual live talk an agent spends with a customer during an outbound call. This does not include the time the agent placed the customer on hold.
• Average Talk Time - the average duration of talk time per call for both inbound and outbound.
• Inbound Transfers - total number of inbound transfers per agent.
• Inbound Transfers, % - the percentage of inbound calls that had at least one transfer, compared to the total number of answered calls.
• Total Hold Time - total duration of all hold periods in all inbound calls.
• Average Hold Time - the average duration of hold time per call where a caller was put on hold.
• Longest Hold Time - longest time any caller spent on hold during a call with an agent. This is also the longest registered time of hold for a particular agent out of all his/her calls.
• Average SoA (Average speed of answer) - the average time it takes an agent to pick up a call from the time the call is directed to an agent to the time the agent picked up the call.
• Total Handle Time - total duration of talk time plus total hold time.
• Inbound Handle Time - total duration of inbound talk time, including the hold time in inbound calls.
• Outbound Handle Time - total duration of outbound talk time, including the hold time in outbound calls.
• Average Handle Time - the average duration of inbound and outbound calls, including the hold time.
• Longest Handle Time - longest talk time plus hold time across all calls of an agent over a chosen period of time.
Adding an Agent details Widget
Step 1:
Click Add Widget.
Step 2:
Click Agents details.
Step 3:
Fill out the following information.
1. Enter the Name.
2. Define the width and height of the Widget.
3. Select one or multiple queues.
4. Select the metrics that should appear as Columns.
5. Select the Time period.
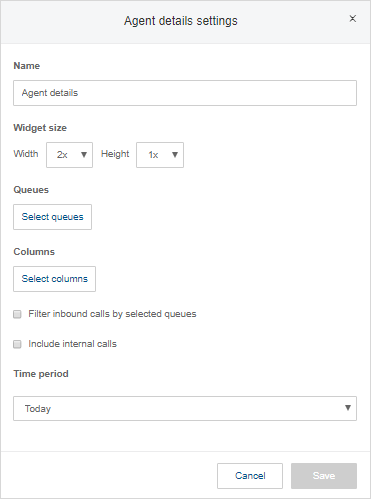
Step 4:
Click Save.

Exporting Data
This feature exports exactly the same rows and columns as seen on the Widget. You can export data into a PDF or CSV file.
Step 1:
Click the More options button located in the upper right corner of the Widget.
Step 2:
Select Export as PDF or Export as CSV.
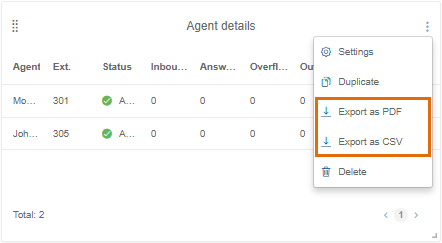
Step 3:
Save the file to your computer.
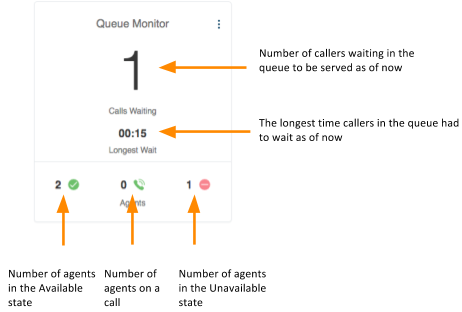
Queue Monitor
This Widget shows callers waiting in the queue to be answered.
NOTE: the longest wait time indicator appears only if any callers are waiting.
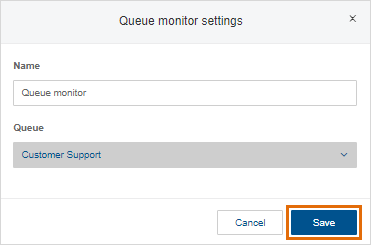
Adding a Queue Monitor Widget
Step 1:
Click Add Widget.
Step 2:
Click Queue monitor.
Step 3:
Fill out the following information.
1. Enter the Name.
2. Select a Queue to monitor.
NOTE: There is no need to set the time period since this Widget displays data at the current moment.
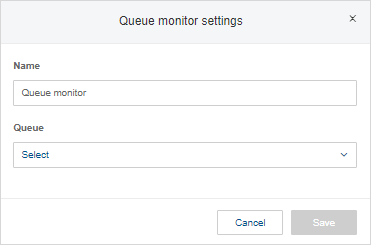
Step 4:
Click Save.
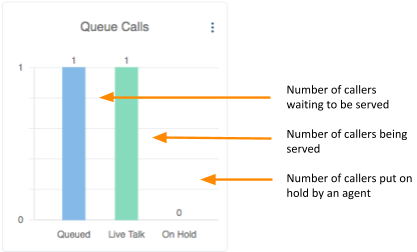
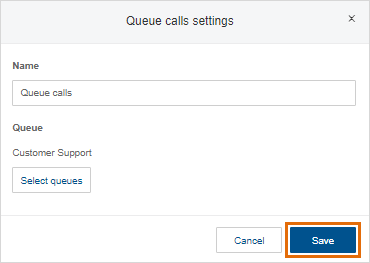
Queue Calls
This Widget displays the status of callers in the queue.
Adding a Queue Calls Widget
Step 1:
Click Add Widget.
Step 2:
Click Queue calls.
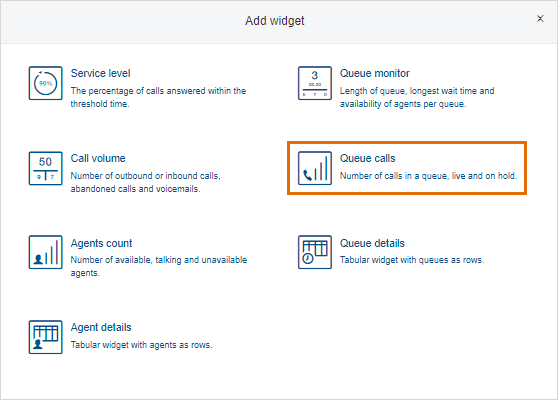
Step 3:
Fill out the following information.
1. Enter the Name.
2. Select one or multiple queues to monitor
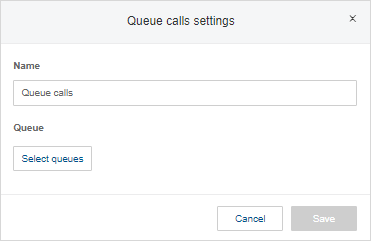
Step 4:
Click Save.
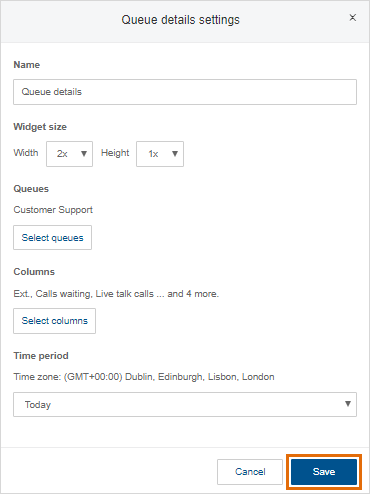
Queue details
This Widget shows detailed reporting data broken down by queues.
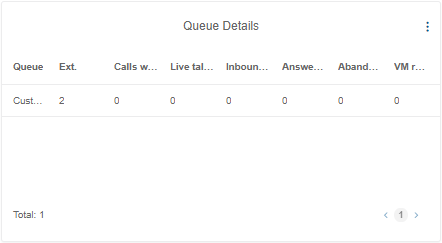
Metrics available
• Ext. - the phone extension assigned to the queue.
• Calls Waiting - the count of calls waiting in the queue right now.
• Live Talk Calls - the count of calls that are being answered right now.
• Inbound Calls - the count of all inbound calls directed to a queue.
• Answered Calls - the count of all inbound calls answered by agents in the queue.
• Overflow Answered - the count of queue calls answered by agents of overflow queues.
• Abandoned Calls - the count of all inbound calls that were abandoned before they were answered.
• VM Redirects - the count of redirects to the voicemail regardless of whether a message was left.
• Total Handle Time - total time spent by all agents handling all inbound queue calls, including total hold time.
• Average Handle Time - the average time to handle an inbound call, including hold time.
• Longest Handle Time - longest talk time, plus hold time across all calls of an agent over a chosen period of time.
• Total Hold - total duration of all hold periods in all calls in the queue.
• Average Hold - average duration of a hold period.
• Longest Hold - the longest hold period across all the calls of a particular queue.
• Total Talk Time - total duration of all talk sessions.
• Longest Talk Time - - the longest talk time across all the calls of a particular queue. This does not include hold time.
• Average Talk Time - the average live talk session (holds are not included) across all calls of a particular queue.
• Service Level - percentage of calls answered within a predefined time threshold.
• Avg. time to Abandon - average time spent in the queue for abandoned calls.
• Average Speed of Answer (SoA) - average time for calls to be answered. Total SoA includes both wait time and duration of a queue greeting.
• Longest Wait - the longest time a call had to wait in the queue.
• Shortest Wait - the shortest time a call had to wait in the queue.
Adding a Queue details Widget
Step 1:
Click Add Widget.
Step 2:
Click Queue details.
Step 3:
Fill out the following information.
1. Enter the Name.
2. Enter the width and height of the Widget.
3. Select one or multiple queues.
4. Select the metrics that should appear as Columns.
5. Select the Time period.
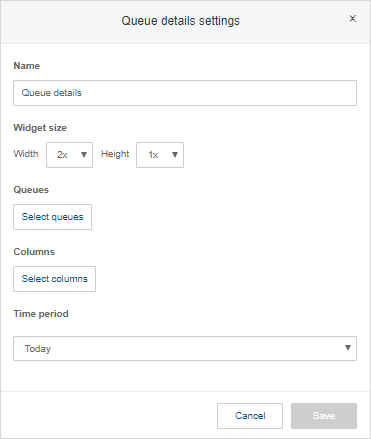
Step 4:
Click Save.
Exporting Data
This feature exports exactly the same rows and columns as seen on the Widget. You can export data into a PDF or CSV file.
Step 1:
Click the More options button located in the upper right corner of the Widget.
Step 2:
Select Export as PDF or Export as CSV.
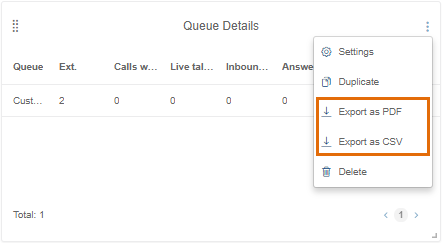
Step 3:
Save the file to your computer.

